Say you want to build an innovative new information service for the energy system. Maybe that’s an interactive map of energy assets; or a resource assessment tool that automatically determines the cheapest place to install new distributed energy resources (DERs); or a new energy forecasting service; or a digital twin of the entire energy system; or a new demand side flexibility service; or something no one has even thought of yet…
To build any information service, you’ll need to:
- Search for energy datasets and energy assets;
- Access those datasets;
- Interpret each dataset;
- Join multiple datasets together.
This sequence of four steps should take a few seconds: Finding energy data & information about assets should be as easy as a web search.
But, today, these four steps require an incredible amount of tedious ‘manual’ work and so often take months to complete (and sometimes it’s simply impossible to complete these steps). This friction costs money and time, inhibits innovation, and slows the rate at which we can reduce carbon emissions to net-zero.
In this document, we’ll look at a single technical framework that could help solve all these problems: linked data.
Overview of the web of energy data
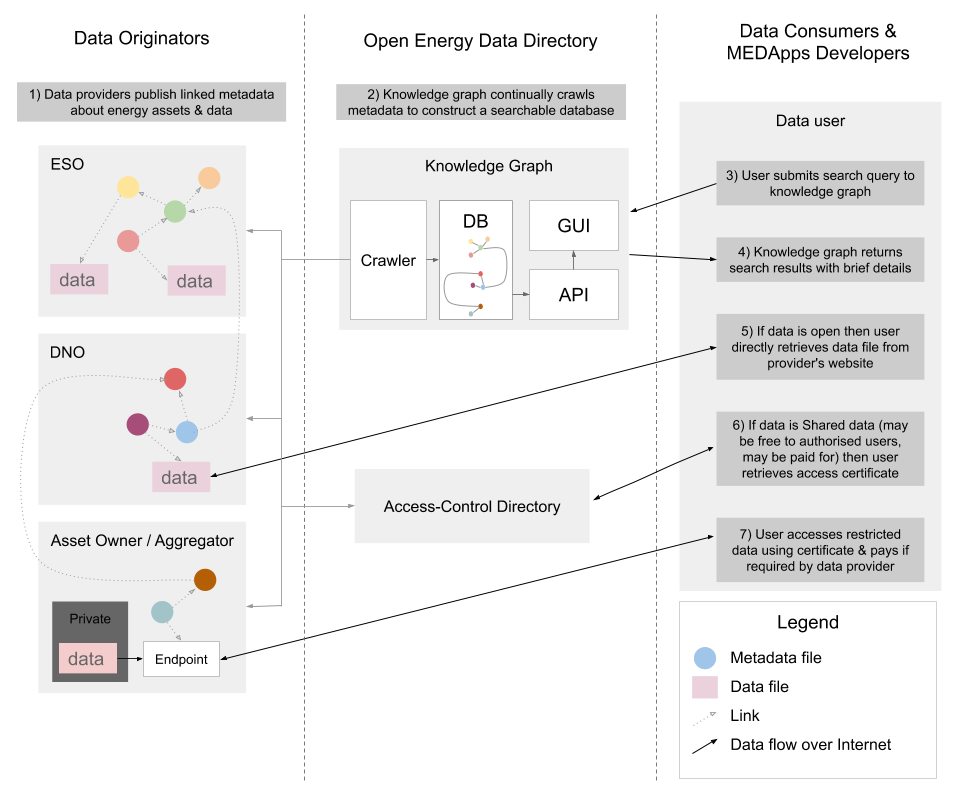
- Data & metadata files will reside on data custodians’ web servers.
- A search engine will provide an entry point into the ‘web of energy data’.
- The search engine will construct a ‘knowledge graph’ of the web of energy data by crawling the metadata files.
- This is far more than ‘just’ a list of assets and datasets! It will understand the relationships and the meaning of the data, hence enabling:
- highly specific searches
- discovery of data & assets by walking the knowledge graph
- A Directory (adapted from Open Banking) will associate parties with security credentials. This will limit access to shared data: data which is available only to specific groups of people, for specific purposes. For example, access controls might be necessary for personally identifiable information; or commercially sensitive information; or information that could be used to disrupt the energy system.
- Every thing (substation, dataset, energy company, etc.) will have a unique ID.
- This ID will take the form of a web address (URL).
- Accessing that web address will return metadata describing the thing.
- The metadata will be in a standard format and use a standard vocabulary; and will link to related resources (just as web pages link to other web pages).
- Taken together, these linked metadata files will form a distributed graph (‘network’) representing the energy system itself and energy datasets; and their relationships.
- Metadata will be compatible with search engines, so users can also enter the “web of energy data” through conventional search engines.
- Open data (as distinct from metadata) can be published in any machine-readable format. But there may be recommended formats for new datasets.
- A standard API will be defined to allow data providers to restrict access to shared data (data that is sensitive or requires payment).
Benefits
Just like the world wide web, content on the ‘web of energy data’ will be:
- No “big-bang” IT projects: Allow industry to adapt piece-by-piece.
- Distributed: Organisations host data on their own servers so will retain full control. No single point of failure. Scales rapidly.
- Easy to interpret: Metadata will use a common technical language.
- Easy to create: The metadata standard will be as simple as possible, and as similar as possible to existing vocabularies.
- Uniquely identifiable: Hence trivial to combine. Unique identifiers for energy assets & datasets is the first step towards combining existing energy asset registers.
- Linked to related assets.
- Searchable & Discoverable through the Knowledge Graph.
- Secured using a Directory adapted from Open Banking.
What does success look like?
- Substantially reduced costs and time to publish and consume energy data.
- Spawn a vibrant ecosystem of innovative energy information services.
- Data and assets will be easy to find as searching the web for a local restaurant.
- Enable an energy system capable of orchestrating millions of DERs.
- Hence help reduce carbon emissions to net-zero without breaking the bank! (The bit that Open Climate Fix is most passionate about!)
Principles
- Enable the rest of the ecosystem: Don’t compete.
- Collaborate deeply.
- All code & research will be open.
- Build on existing work. Don’t reinvent the wheel.
- Engage with existing industry groups.
Linked data for the energy system
Linked data is an evolution of the world wide web.
The web is a distributed, linked documentation system. Web pages are primarily written for people. But it turns out that machines have a hard time understanding content that’s written for human consumption. To understand natural language you have to know a lot about how the world works, including how people think. Machines struggle with that.
This wasn’t a problem when the web was small. But, as the web grew, users needed help searching and processing information on the web. Early automated search tools often produced unsatisfactory results because they struggled to understand the web’s content.
Today, increasingly large numbers of web sites solve this problem using ‘linked data’: metadata in a standard format which makes content easy for machines to understand. Linked data makes it easier to build automated tools to help us search and process vast quantities of distributed data.
Linked data is sometimes called ‘Web 3.0’ and is the brainchild of Sir Tim Berners-Lee (the inventor of the web). Domains such as biomedical science have used linked data for years to build very powerful, distributed representations of knowledge.
In Sir Tim Berners-Lee’s 2009 TED talk on Linked Data, he gave three “extremely simple” principles behind linked data. Here are those three principles applied to energy data:
- Every thing (dataset, transformer, meter, energy company, etc.) gets a unique name. Each name is a URL (a web address).
- If I take one of these URLs and I look it up then I get a description of that thing. That description will be in a standard format and will use standard naming conventions.
- That description also includes relationships by linking to URLs of related things. For example, a transformer would link to the meters attached to that transformer, and those meters would link to descriptions of time series datasets recorded from those meters, and those descriptions would link to the data.
What would a ‘web of energy data’ look like?
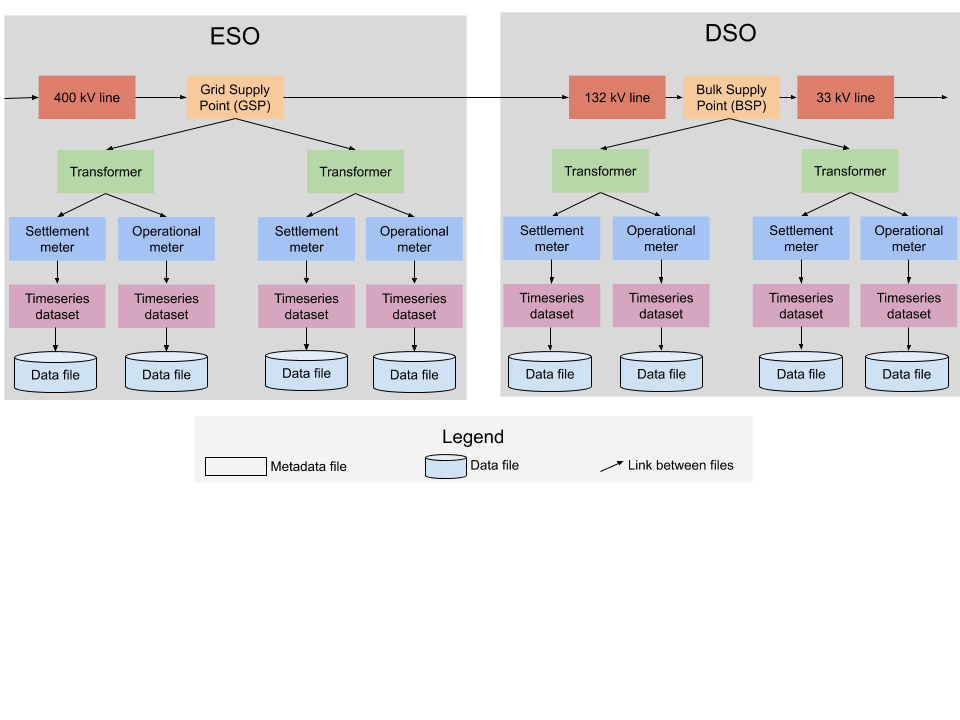
Maybe the National Grid ESO would publish linked data describing the transmission system. For example, each grid supply point (GSP) could be identified by a unique web address (e.g. NationalGridESO.com/GSP#NEWX_1). Accessing that web address would return a machine-readable file describing that GSP and linking to descriptions of the supergrid transformers that make up the GSP (see Figure below). To make life as easy as possible for the ESO, this data would be converted from the ESO’s existing CIM models.
The DNOs could publish descriptions of the distribution system. These descriptions would be machine-readable and use a common standard, hence making it trivial to combine models from all DNOs into a description of the entire distribution system.
In the figure below, the rectangles represent metadata files published on the ESO and a DSO’s website. Note that the DSO doesn’t need to create their own representation of each GSP. Instead, the DSO’s metadata just links to the ESO’s description of each GSP.
DSR aggregators could publish metadata describing their portfolios and pricing, etc.
So we’d end up with lots of metadata files (each describing a thing) scattered across the web. Great. But, um, how do users find anything?!
A search engine for linked energy data
On the web, we use search engines to find information. So let’s build a search engine for linked energy data. But we don’t want just any old search engine…
Remember that the proposed metadata files describe relationships: they’re linked. In computer-science-speak, we’d say the files constitute a ‘distributed graph’, where ‘graph’ means a network of nodes (things) connected by edges (the relationships between things). So, to exploit the full power of the web of energy data, we need a search engine that can capture these relationships: a ‘knowledge graph’. This would continually read all the metadata files to construct a single ‘graph’ describing the energy system.
This knowledge graph will provide far more than just a catalogue of datasets and assets! The knowledge graph will understand the relationships between things; and will understand the meaning of the descriptions. So users will be able to run queries like:
- List all the solar PV systems on constrained parts of the network.
- List all wind farms which openly publish time series datasets recording their outturn.
- List all energy assets, along with their geographical location (to preserve privacy, domestic assets would only show their approximate location)
These queries should return results in a fraction of a second, even though the source data is distributed across many systems.
Note that we don’t need to build a ‘full’ search engine: The knowledge graph will only crawl energy metadata. It won’t attempt to crawl all the linked data on the web! Nor will it store any datasets: The knowledge graph will only copy the metadata.
There are several off-the-shelf graph databases available: We don’t need to invent much technology; we mostly just have to bolt together existing technology.
How does the knowledge graph find metadata to crawl? To start with, people will manually enter the web addresses of descriptions of energy things. From that first metadata file, the crawler will follow links to other metadata files. As the metadata becomes more interconnected, the crawler will be able to find more and more metadata on its own.
The knowledge graph may perform other functions: it could track search statistics to allow the community to measure interest in particular datasets; it could validate the metadata it crawls to automatically alert data owners when metadata needs to be fixed; and it could associate datasets with documentation, discussion and tools.
(The most famous ‘knowledge graph’ is probably Google’s knowledge graph. You see results from Google’s knowledge graph when Google shows an ‘infobox’ with search results.)
Just as there are multiple web search engines, there could be multiple ‘energy knowledge graphs’. The source data is distributed and open. And, once users know what data they need, they can go straight to the data source without going through the knowledge graph.
See the appendix for more information on the knowledge graph for energy data & assets.
How to build a linked web of energy data
- Agree on a common technical language for describing energy assets
- First, collect the requirements for a common language by surveying existing datasets and talking to the community. What concepts must the language be able to describe?
- Then survey existing metadata schemas & ontologies. Do any of them satisfy all the requirements?
- If not: Start sketching out a new schema:
- in intimate collaboration with the industry,
- and building from existing schemas where possible.
- Where appropriate, engage with existing industry bodies.
- Focus on real-world use-cases: Don’t try to describe the entire universe!
- The metadata should be compatible with existing search engines.
- Keep it simple! Unnecessary complexity has killed many linked data projects in the past.
- Figure out the technical & organisational structures to enable the community to evolve the standard over time.
- Convert some existing datasets to the new format. e.g.
- Renewable Energy Planning Database (REPD)
- System Wide Resource Register (SWRR)
- Embedded Capacity Register (ECR)
- (Once these conversions are done, these datasets will be crawlable by Google Dataset Search)
- Work with existing data providers to help them convert their public data to the new format.
- Build a ‘minimal viable product’ of the knowledge graph in the cloud using an off-the-shelf graph database.
- Build tools to make it as easy as possible to contribute to the ‘linked web of energy data’. Example tools might include:
- Energy companies are very comfortable using Excel. So let’s build a web tool to convert metadata descriptions created in Excel to the format used by the ‘linked web of energy data’.
- A ‘wizard’ to author metadata from scratch.
- Validators to check metadata.
Unique identifiers are essential
Unique IDs are absolutely fundamental to information management. Without Unique IDs, users can’t automatically combine datasets or follow links to related assets.
Imagine running a large international company if the only identifier you have for each employee is their nickname. It would be impossible! Each identifier (nickname) could be associated with thousands of individuals. There’d be no way to distinguish between all the “Jacks”. Even trivial operations like joining two database tables would be impossible (e.g. one table giving date of birth for each nickname; and another table giving address for each nickname). Companies fix this problem by assigning each employee a unique ID.
Today, we have multiple energy asset registers in the UK (e.g. FiT & REPD). These are extremely hard to combine because they do not use universal, unique IDs. Even within some energy companies, different IT systems use different names for the same physical bits of infrastructure! We need to fix this! We need unique IDs. Once we have unique IDs, we can then map existing asset registers onto the unique names, and hence build a complete asset register.
Enable users to search across assets and datasets at the same time
Energy assets and energy datasets are intimately linked. Data describes assets. Assets create data. An ‘asset registry’ and a ‘dataset registry’ are just two views of the same physical system. To interpret a dataset correctly, users need to understand the assets that produced the data. To understand the behaviour of an asset, users need to find data associated with that asset.
As such, the linked metadata will link assets and datasets; and the knowledge graph will allow users to quickly identify datasets created by assets, and identify assets associated with datasets.
How does this make it easier to build an asset register?
Maybe, like today, the energy system of the future wouldn’t have a single asset register: organisations would continue to publish data for assets they’re responsible for.
But, unlike today, all asset registers would be trivial to combine because they’d all use the same identifiers, and they’d use the same ‘language’ to describe assets, and they’d be linked. And there’d be (at least one) knowledge graph that would automatically combine and link all the asset registers together.
So, from a users’ perspective, it should feel like there’s just one asset register: the knowledge graph. But, from a data publishers’ perspective, they get to keep total control over the data that describes their ‘patch’ of the energy system.
A dynamic asset register
Imagine an asset register which not only describes the ‘static’ properties of each asset, but also describes some ‘dynamic’ properties. For example, gas-fired power stations could report their real-time carbon intensity updated every minute, to help refine the Carbon Intensity API’s calculations. Linked data should make a ‘dynamic’ asset register possible: Power stations would update a public metadata file, which links to an ‘official’ asset register, and provides a live view of the asset.
Sensitive metadata
Maybe we don’t want to openly publish the full details of domestic assets. For example, home owners may not want to broadcast to the world that they have an expensive battery installed in their garage.
The public metadata description of domestic assets could just describe an approximate geographical location. The public metadata could link to restricted metadata that would give authorised users the exact location.
Layers of the Energy Onion
The energy system is becoming harder to manage as it becomes more complex. David Sykes’s fascinating Energy Onion article gives insight as to how to manage this complexity: by considering the energy system as a sequence of layers:
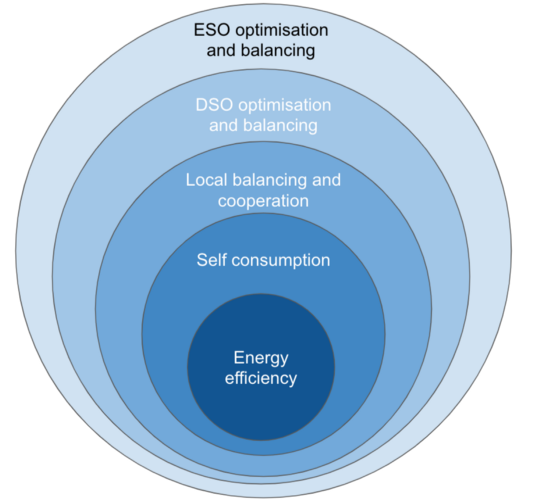
(Image from David’s blog)
This is reminiscent of the way software engineers manage complexity by building layers of abstraction. e.g. Operating systems abstract away the complexity of the hardware. (Or, an even geekier analogy: the TCP/IP networking stack). Maybe David’s layers of the energy onion could be thought of as layers of abstraction?
Inner layers would provide services to the layer immediately above. For example, services which optimise a building’s energy assets to maximise self consumption would be entirely responsible for managing assets within each building. This layer would provide services to the next layer: local balancing and cooperation. These two layers would communicate in both directions. But, crucially, the local balancing layer wouldn’t try to micromanage individual assets. Instead, it would (politely) ask the building’s energy management system to ramp up / ramp down.
The key to managing complexity is to ensure that outer layers don’t micromanage inner layers: An outer layer can’t directly control an inner layer’s assets. Instead, outer layers must go through the inner layer’s interface.
This way of thinking about the energy system also helps inform our priorities for defining standards for data sharing: The priority is to define data standards for the communication between layers. The communication within layers is an ‘implementation detail’ that outer layers don’t need to worry about. (Also see this Vox article: Renewable energy threatens to overwhelm the grid. Here’s how it can adapt.)
How does this fit in with the billion existing energy data projects?
Ha! Good question. And, there really are a lot of existing energy data projects (which is very exciting… but also just a little, um, overwhelming!)
Broadly, the approach isn’t to compete with existing projects. Rather the aim is to enable future & ongoing projects; and to learn from recently completed projects; and to collaborate intimately with the community.
To list a few existing projects:
Open Energy (this initiative)
- A Modernising Energy Data Access (MEDA) project.
- Led by Icebreaker One, in collaboration with PassivSystems & Open Climate Fix.
- MEDA projects finished phase 1 on 2020-07-10
- MEDA projects are currently in Phase 2.
- Icebreaker One is mostly focused on solving the business challenges associated with sharing energy data, but may also have a working group looking at data standards.
- This group is building a ‘linked web of energy data’ with MEDA phase 2 funding
National Digital Twin
We’re very keen to ensure the ‘linked web of energy data’ is compatible with the National Digital Twin, to make it easy to build a ‘twin’ that includes the energy system and the built environment.
Data portals (Flexr, ESO Data Portal, etc.)
The ambition would be to work with Flexr & ESO & others to ensure the ‘common technical language’ is capable of expressing all the concepts these portals need to express, and then to help these portals expose metadata using the ‘common technical language’.
Common Information Model (CIM)
- CIM is already used by parts of the electricity system (e.g. transmission system operators) to describe both the structure of the transmission system, and its dynamical state.
- Officially adopted by the International Electrotechnical Commission (IEC).
- CIM is related to RDF, and RDF is one of the foundations for linked data.
- The linked web of energy data should be able to represent all the concepts already expressed in CIM, to make it easy to convert between CIM and the linked web of energy data. e.g. ESO would just run their existing CIM model through a converter to publish a model compatible with the linked web of energy data.
- On its own, CIM may not be sufficient to represent the entire energy system because:
- CIM doesn’t describe the grid edge,
- CIM only describes electricity, not gas,
- CIM objects can’t be linked over the Internet: A DNO can’t link to the ESO’s definition of a GSP, for example,
- It’s challenging to push new CIM ‘profiles’ upstream, and so different energy companies end up defining different ‘profiles’ for the same concepts. Hence breaking the main point of having a common information model 🙂
ENA’s Digital System Map
- Hopefully the ‘web of linked energy data’ should make it super-easy to build a system map :). The ‘web of linked energy data’ would represent all the map data in a standardised way; and the map UI could be built using an off-the-shelf mapping tool.
Open Energy Ontology
- The OEO is very related!
- Maybe the OEO will be the one ‘magic bullet’ that can describe the energy system or, if not, maybe the OEO can be extended.
- At present, the OEO is focused on energy system modelling, and so can describe the essentials of an energy system (transformers, generators, etc) but doesn’t yet appear to capture some of the implementation details of a real energy system (e.g. GSPs and BSPs; and that transformers might have multiple meters, each with different characteristics, etc.)
Web of Things
- A W3C linked data standard for the Internet of Things
- “Each thing is identified by a URI that can be dereferenced to obtain a machine interpretable description. The URI can also be used as an identifier in rich descriptions as a basis for semantic interoperability between suppliers and consumers of services. Thing descriptions expressed in JSON-LD cover the behavior, interaction affordances, data schema, security configuration and protocol bindings.“
Linux Foundation Energy – Open Energy Data Initiative
- Open energy datasets curated on a single cloud platform
- Open-source tools to access & analyse the datasets
HyperCat
- “HyperCat is an open, lightweight JSON-based hypermedia catalogue format for exposing collections of URIs. Each HyperCat catalogue may expose any number of URIs, each with any number of RDF-like triple statements about it. HyperCat is simple to work with and allows developers to publish linked-data descriptions of resources. HyperCat is designed for exposing information about IoT assets over the web. It allows a server to provide a set of resources to a client, each with a set of semantic annotations. Implementers are free to choose or invent any set of annotations to suit their needs. A set of best practices and tools are currently under development. Where implementers choose similar or overlapping semantics, the possibilities for interoperability are increased“
- GitHub repos haven’t been updated since 2016
SpecialPrivacy.EU
- *”The SPECIAL project (Scalable Policy-aware Linked Data Architecture For Privacy, Transparency and Compliance) addresses the contradiction between Big Data innovation and data protection compliance requirements by proposing a technical solution that makes the achievement of both of these goals realistic. SPECIAL allows citizens and organisations to share more data, while guaranteeing compliance with data protection, thus enabling both trust and the creation of valuable new insights from shared data.”*
- 3 year project. Ended at the end of 2019.
For more details, please see the appendix.
This post is cross-posted from Jack’s blog at Open Climate Fix